Brief
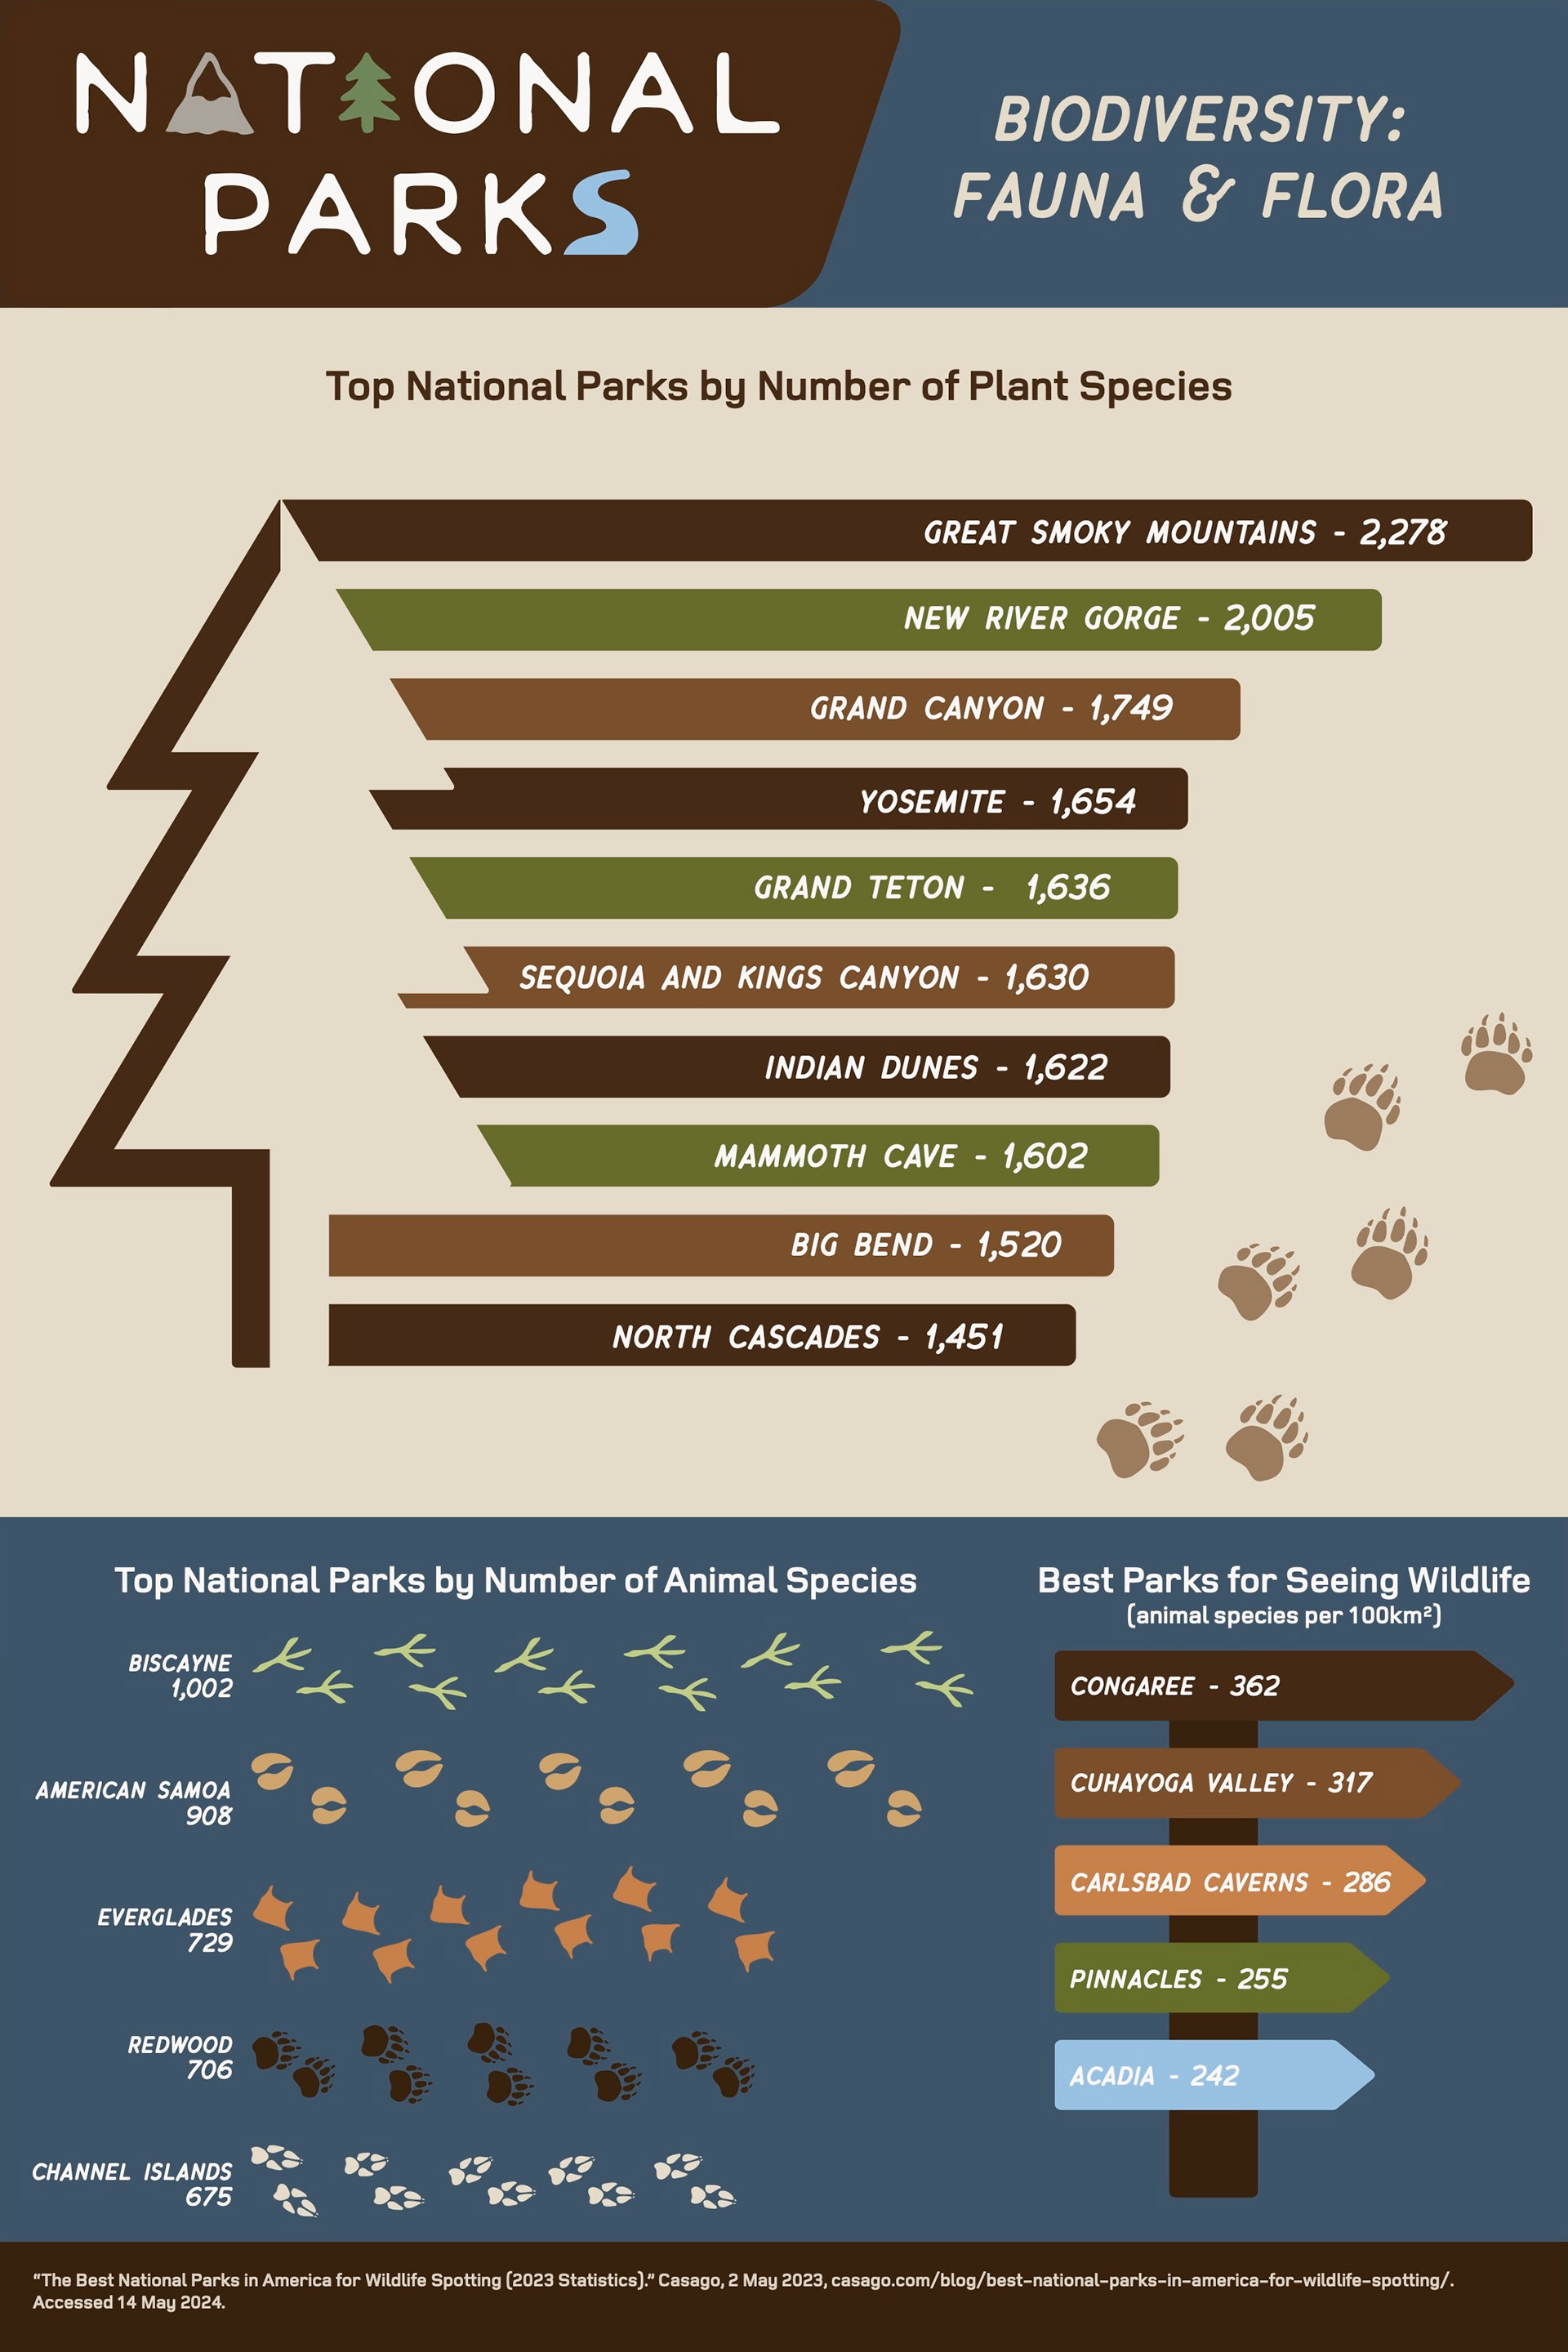
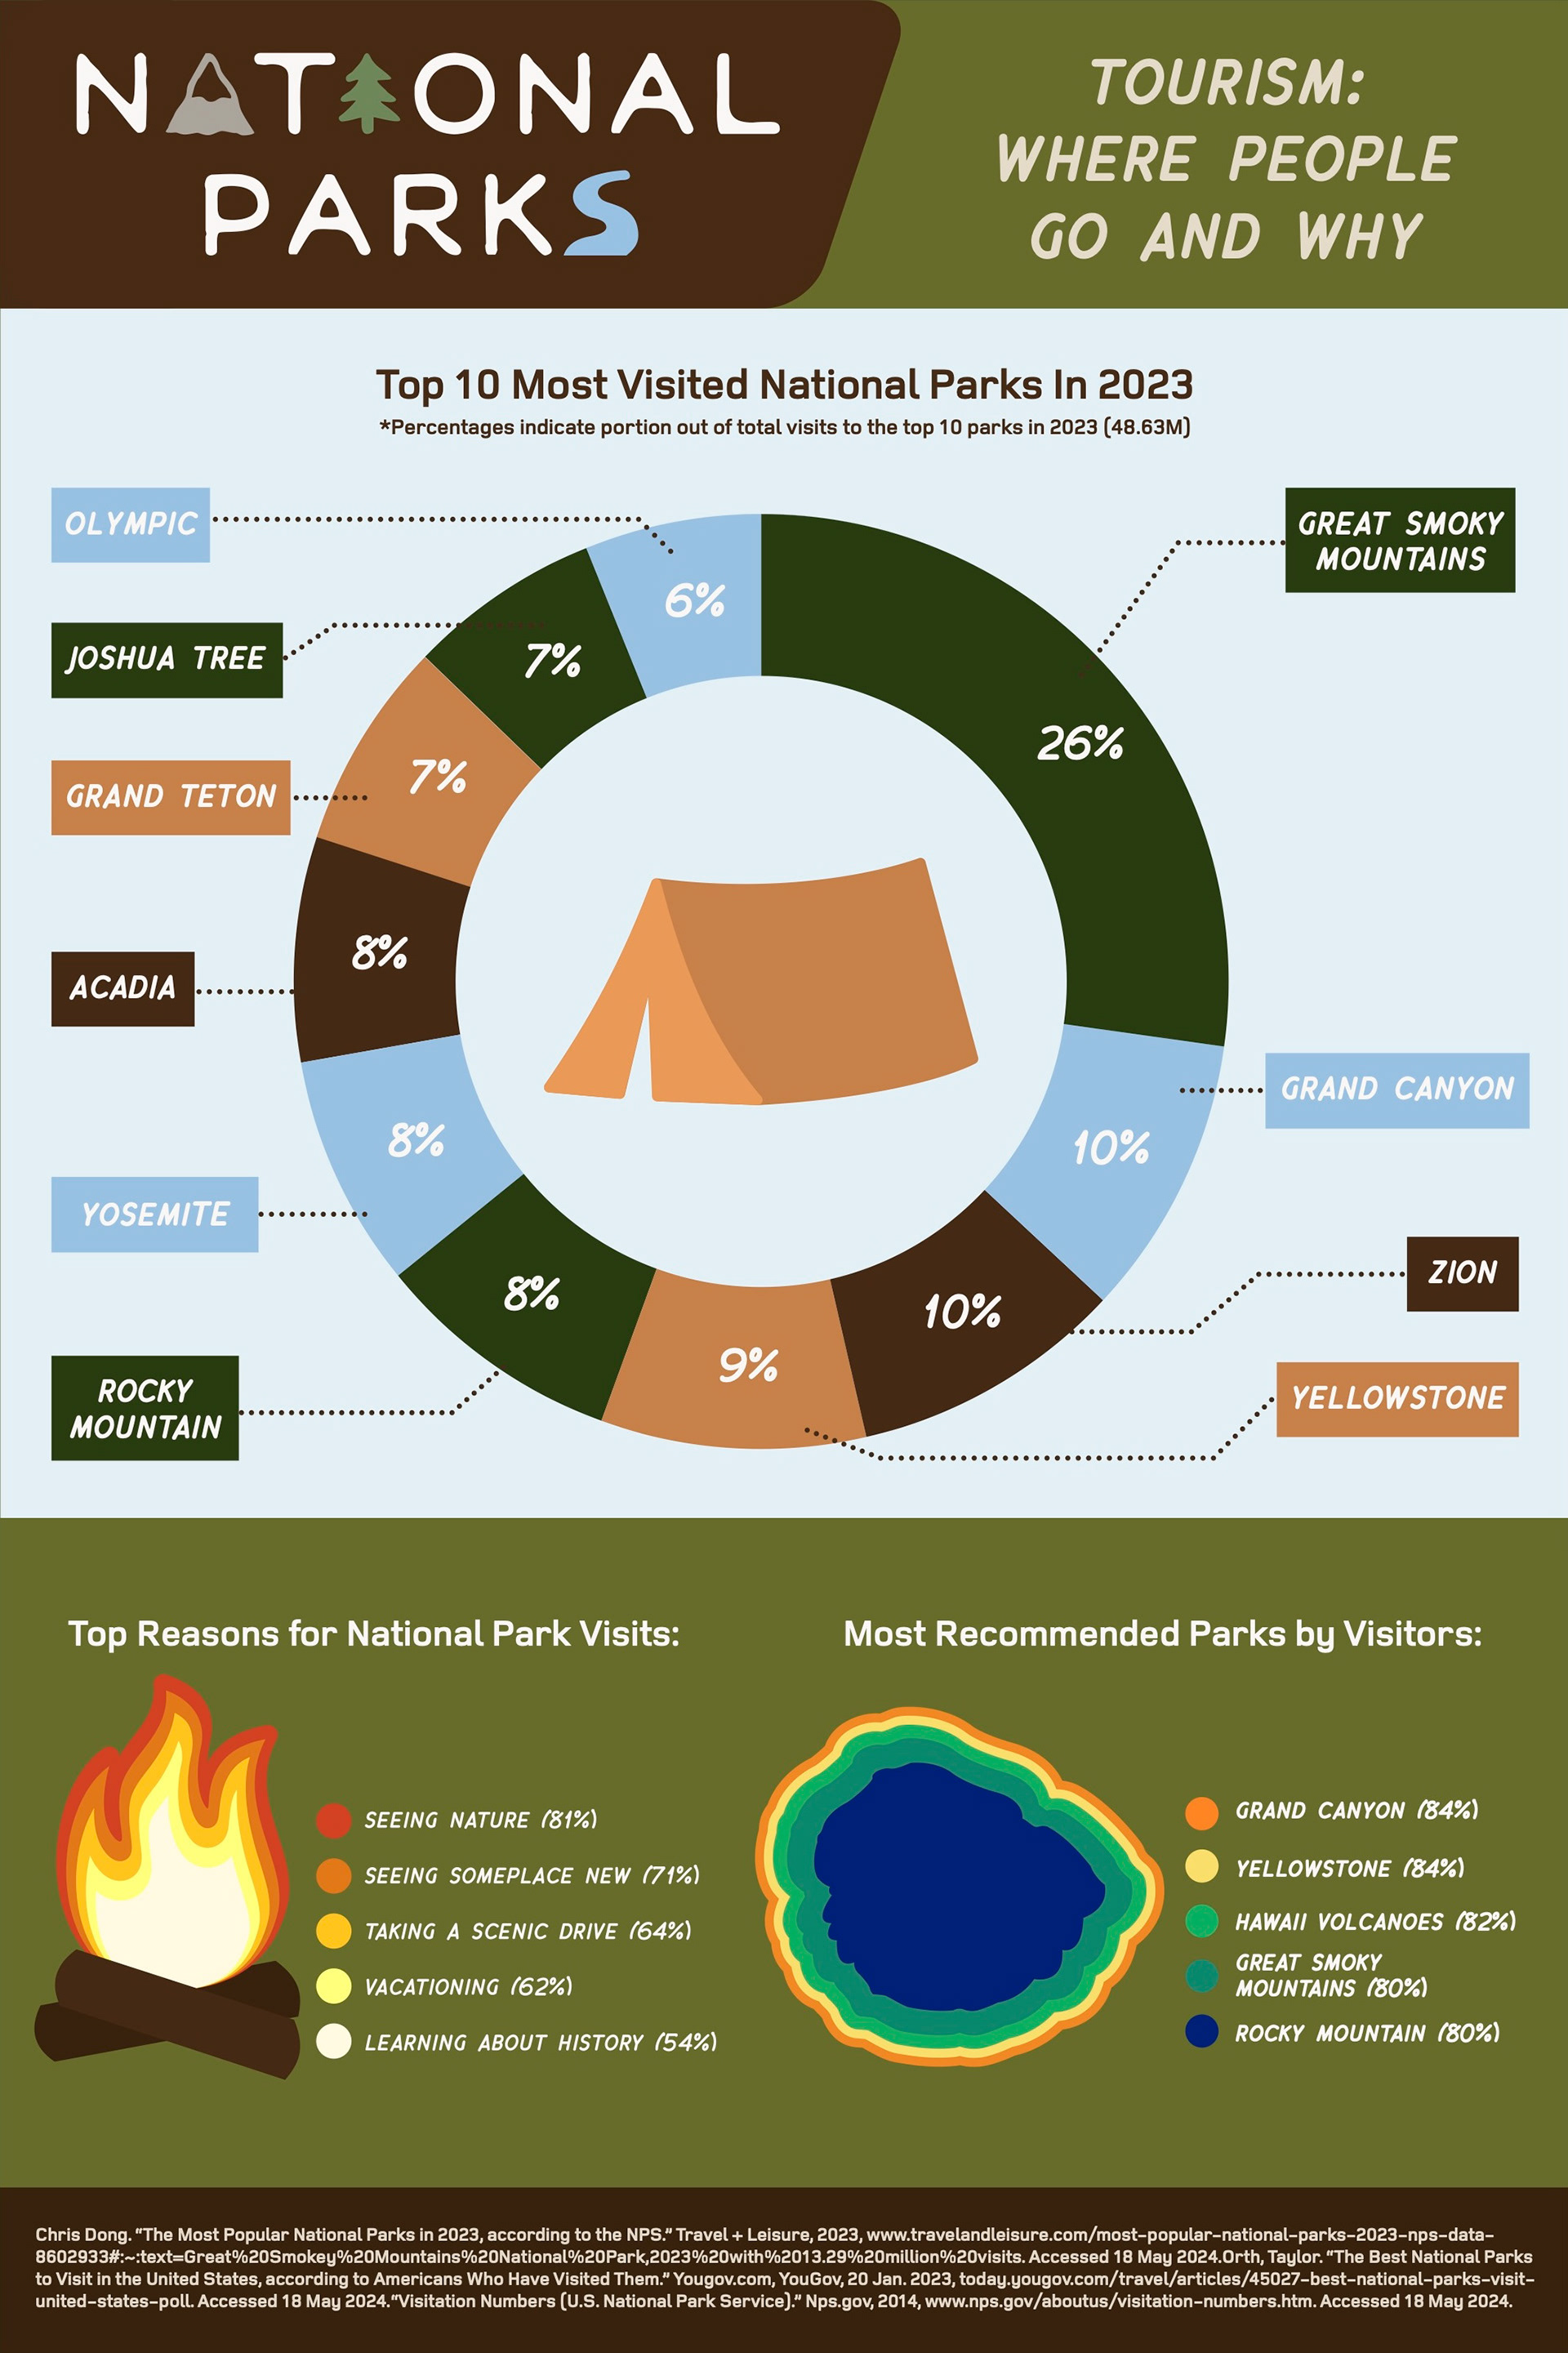
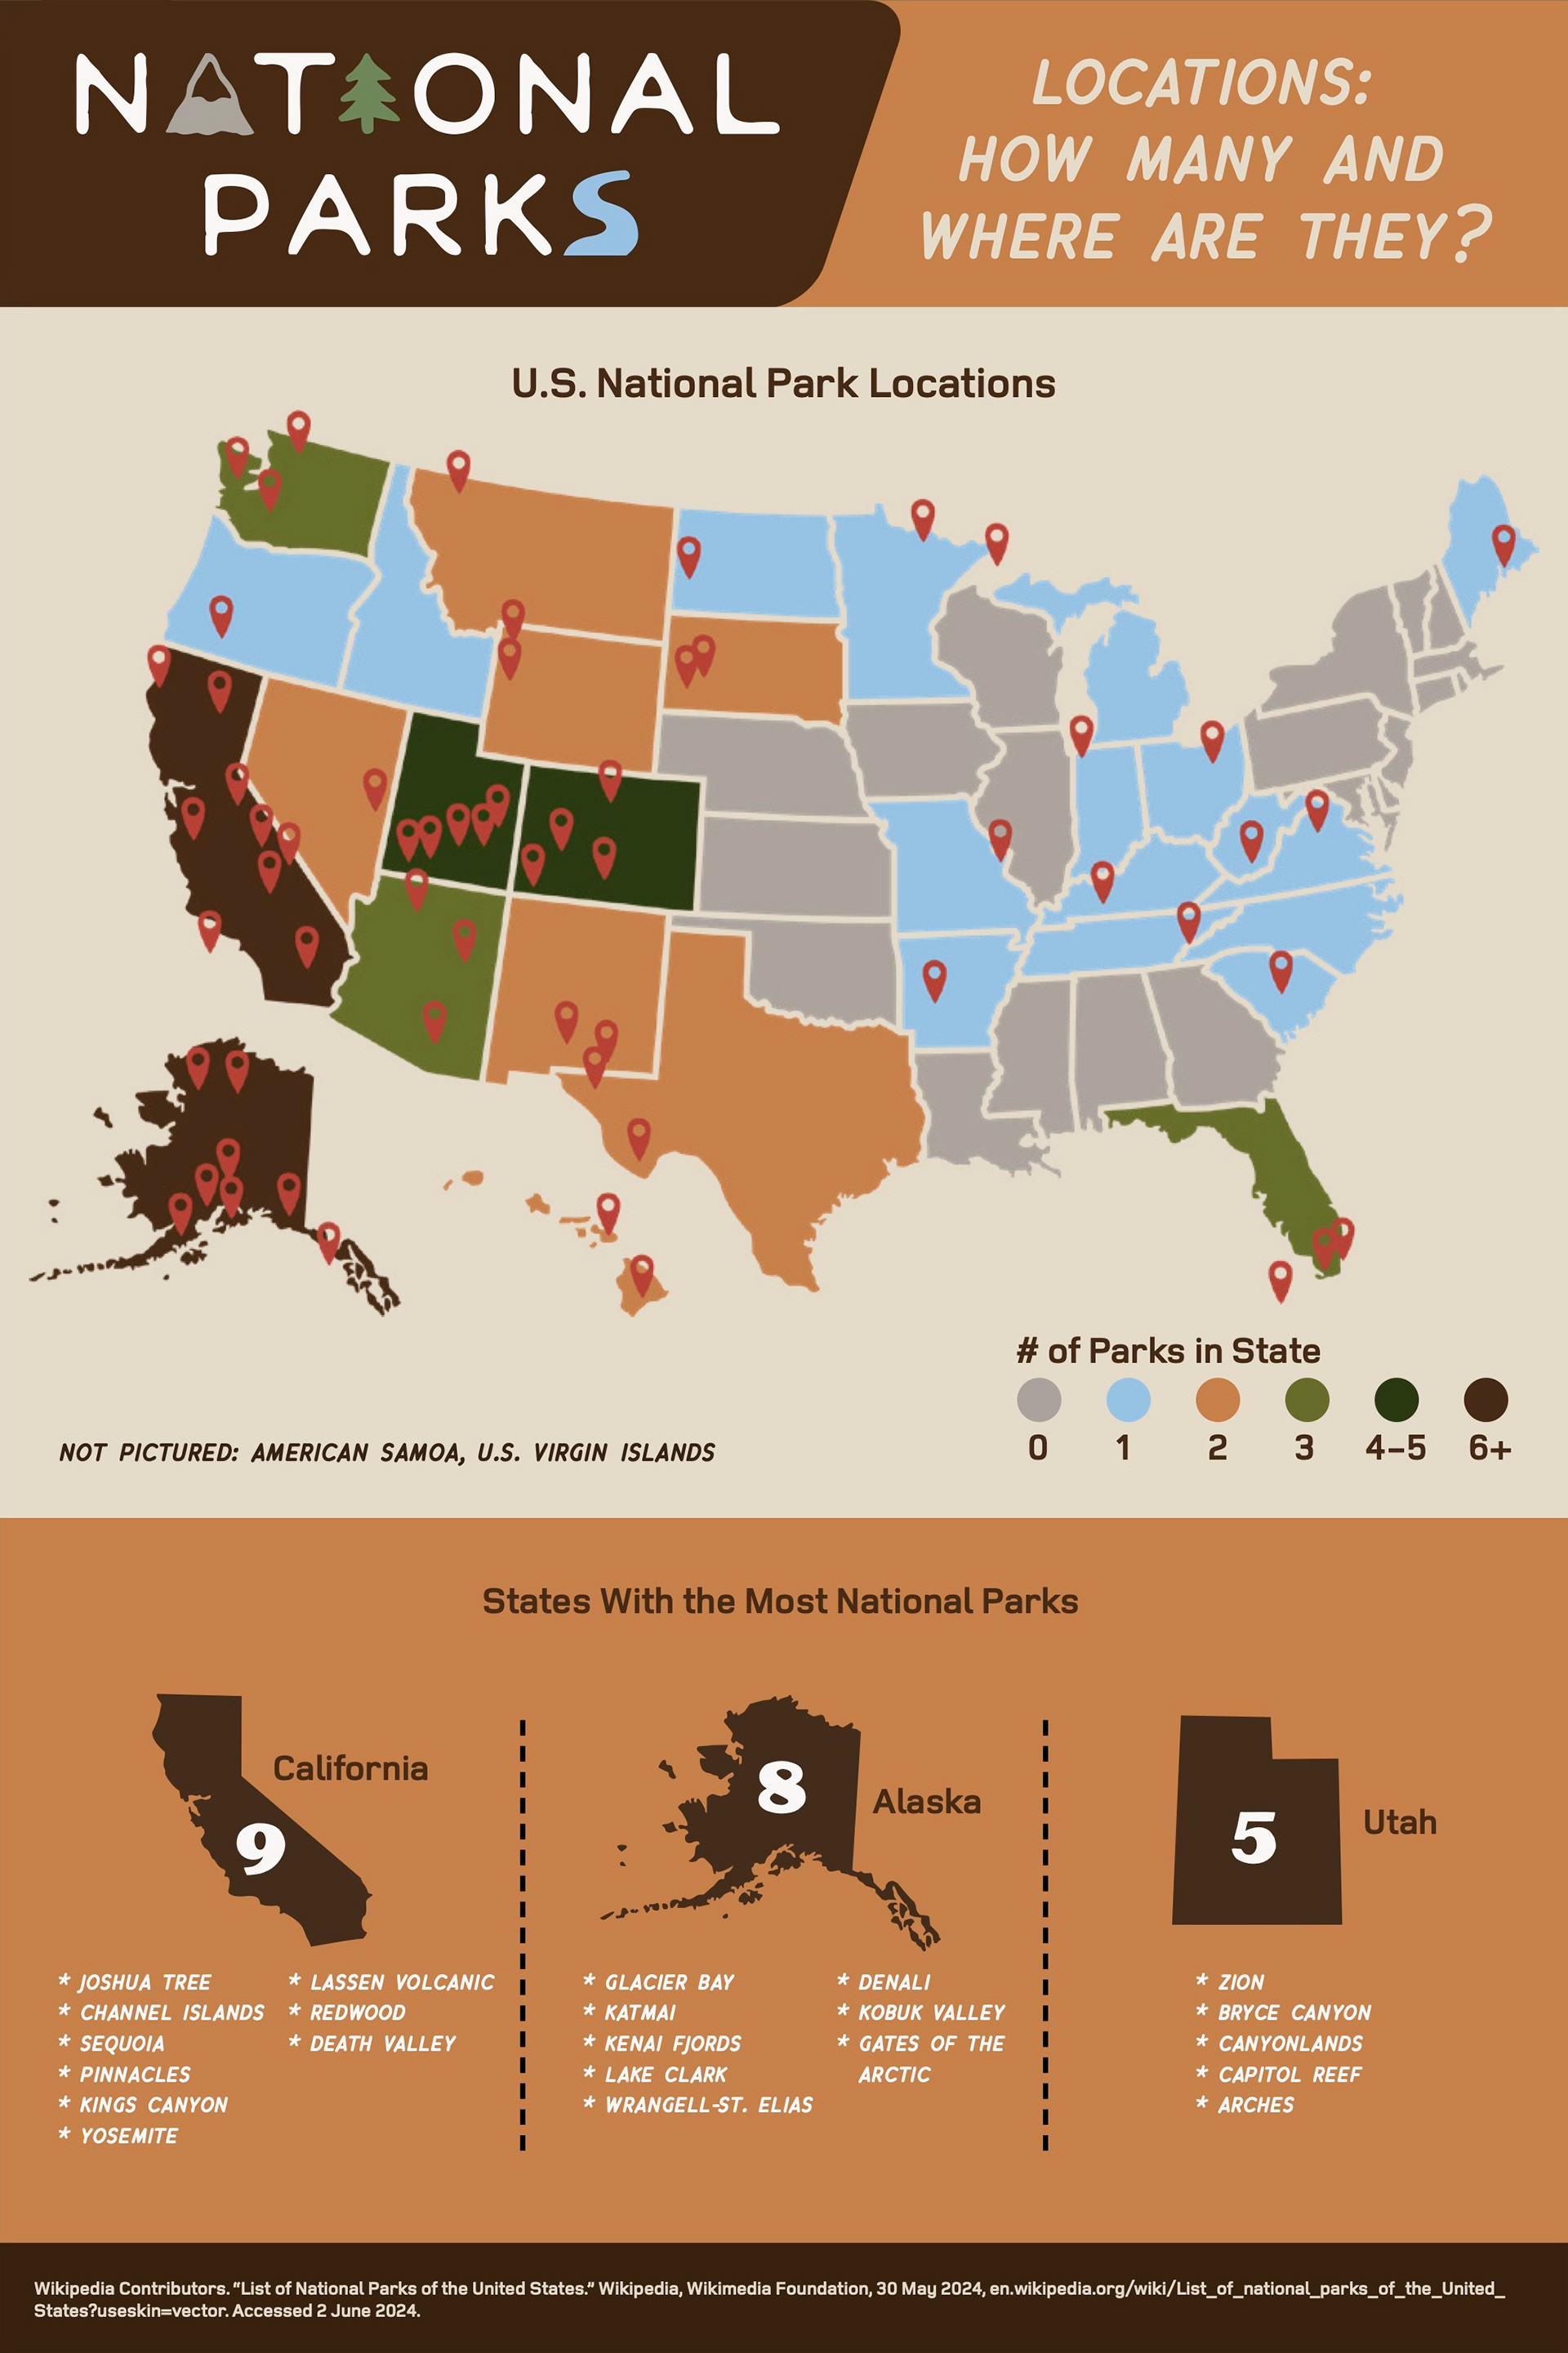
For this data visualization project, I had to make three infographics about a topic of choice and create a title treatment for the project. Each poster needed to feature data about a sub-topic and be illustrated using bars, circles, or maps.
Direction
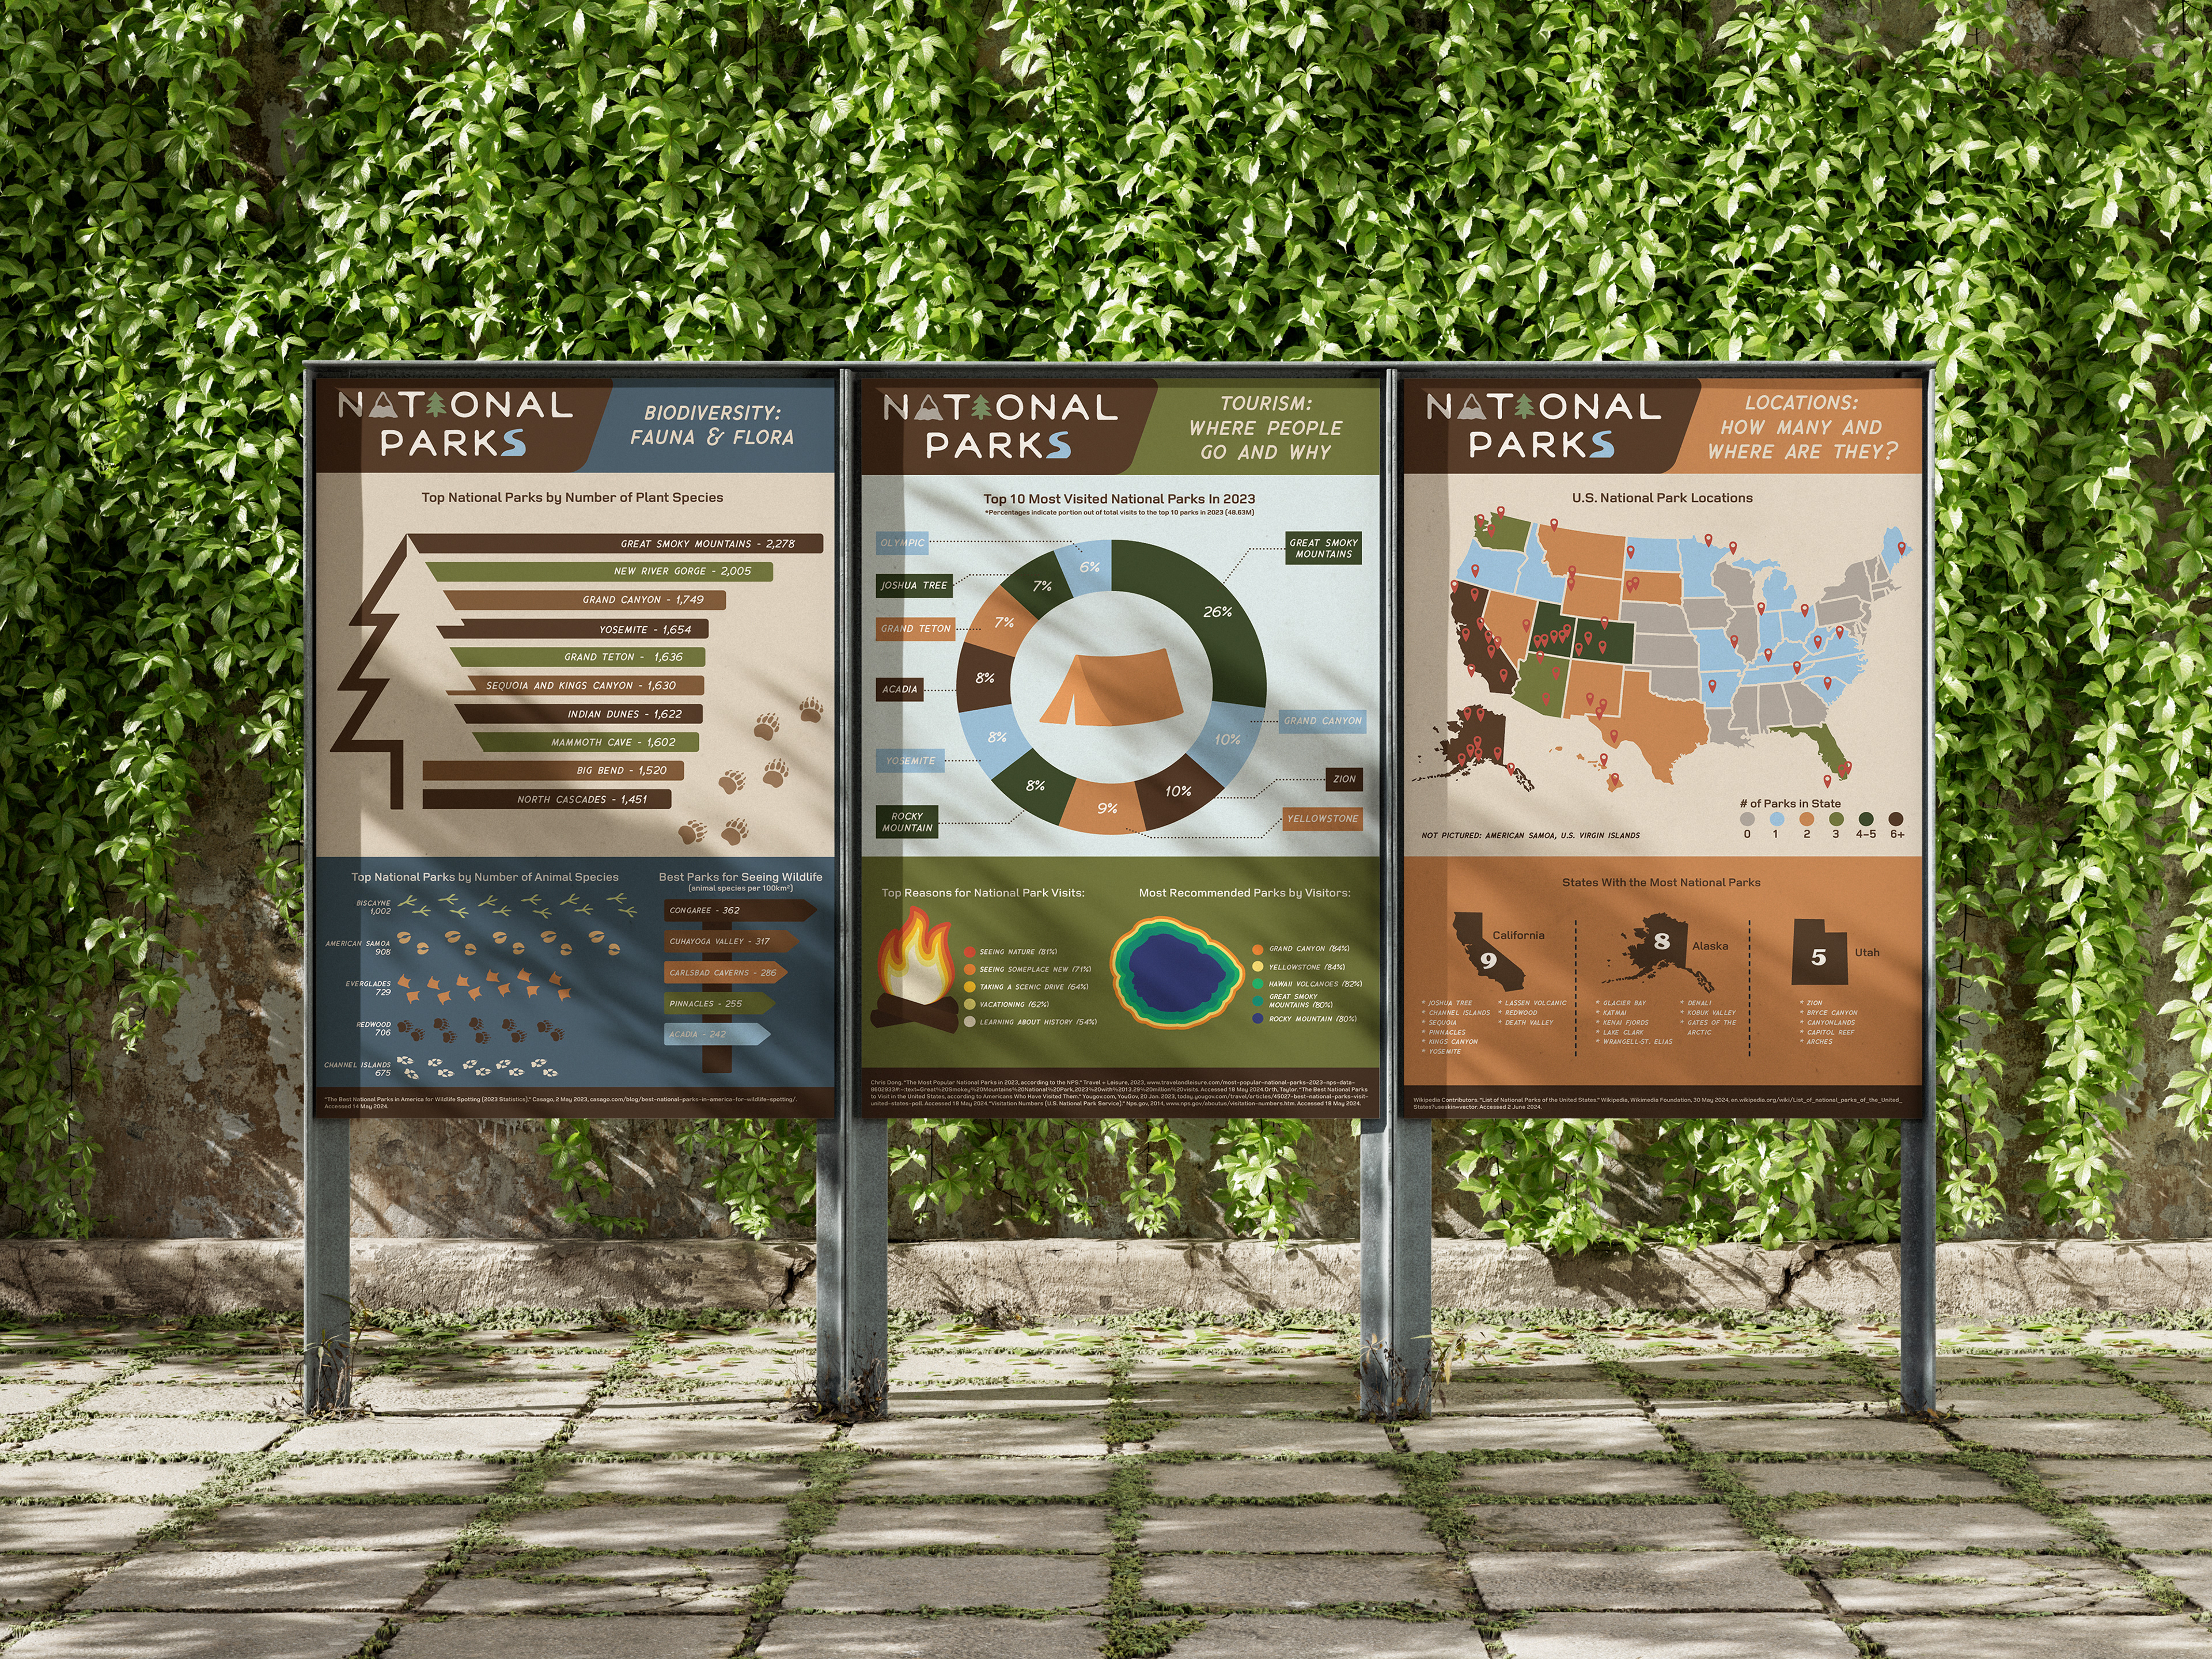
The posters I designed show data about U.S. National Parks, focusing on biodiversity, tourism, and locations. I kept the same template for all three to unify them, but varied the colors and illustrations.
